Living with Green Spaces
Neighborhood Distribution of Residential Addresses in the 'Living with Green Spaces' Study
30 January 2023
The figures illustrate the neighborhood distribution of residential addresses of our survey participants in Hamburg and Cologne (left) as well as the population density in each district (right), with the population count per square kilometer.
In Hamburg, the participants in the 'Living in Green Spaces' study are well distributed across the city, in line with population density. Minor deviations result from the fact that the assignment of interviews to specific neighborhoods was not always possible, for example, because respondents only provided the overarching district. The overrepresentation of residential addresses in Bergedorf, for example, arises from the fact that this district and the overarching district share the same name, and a subsequent differentiation between these entries is not possible.
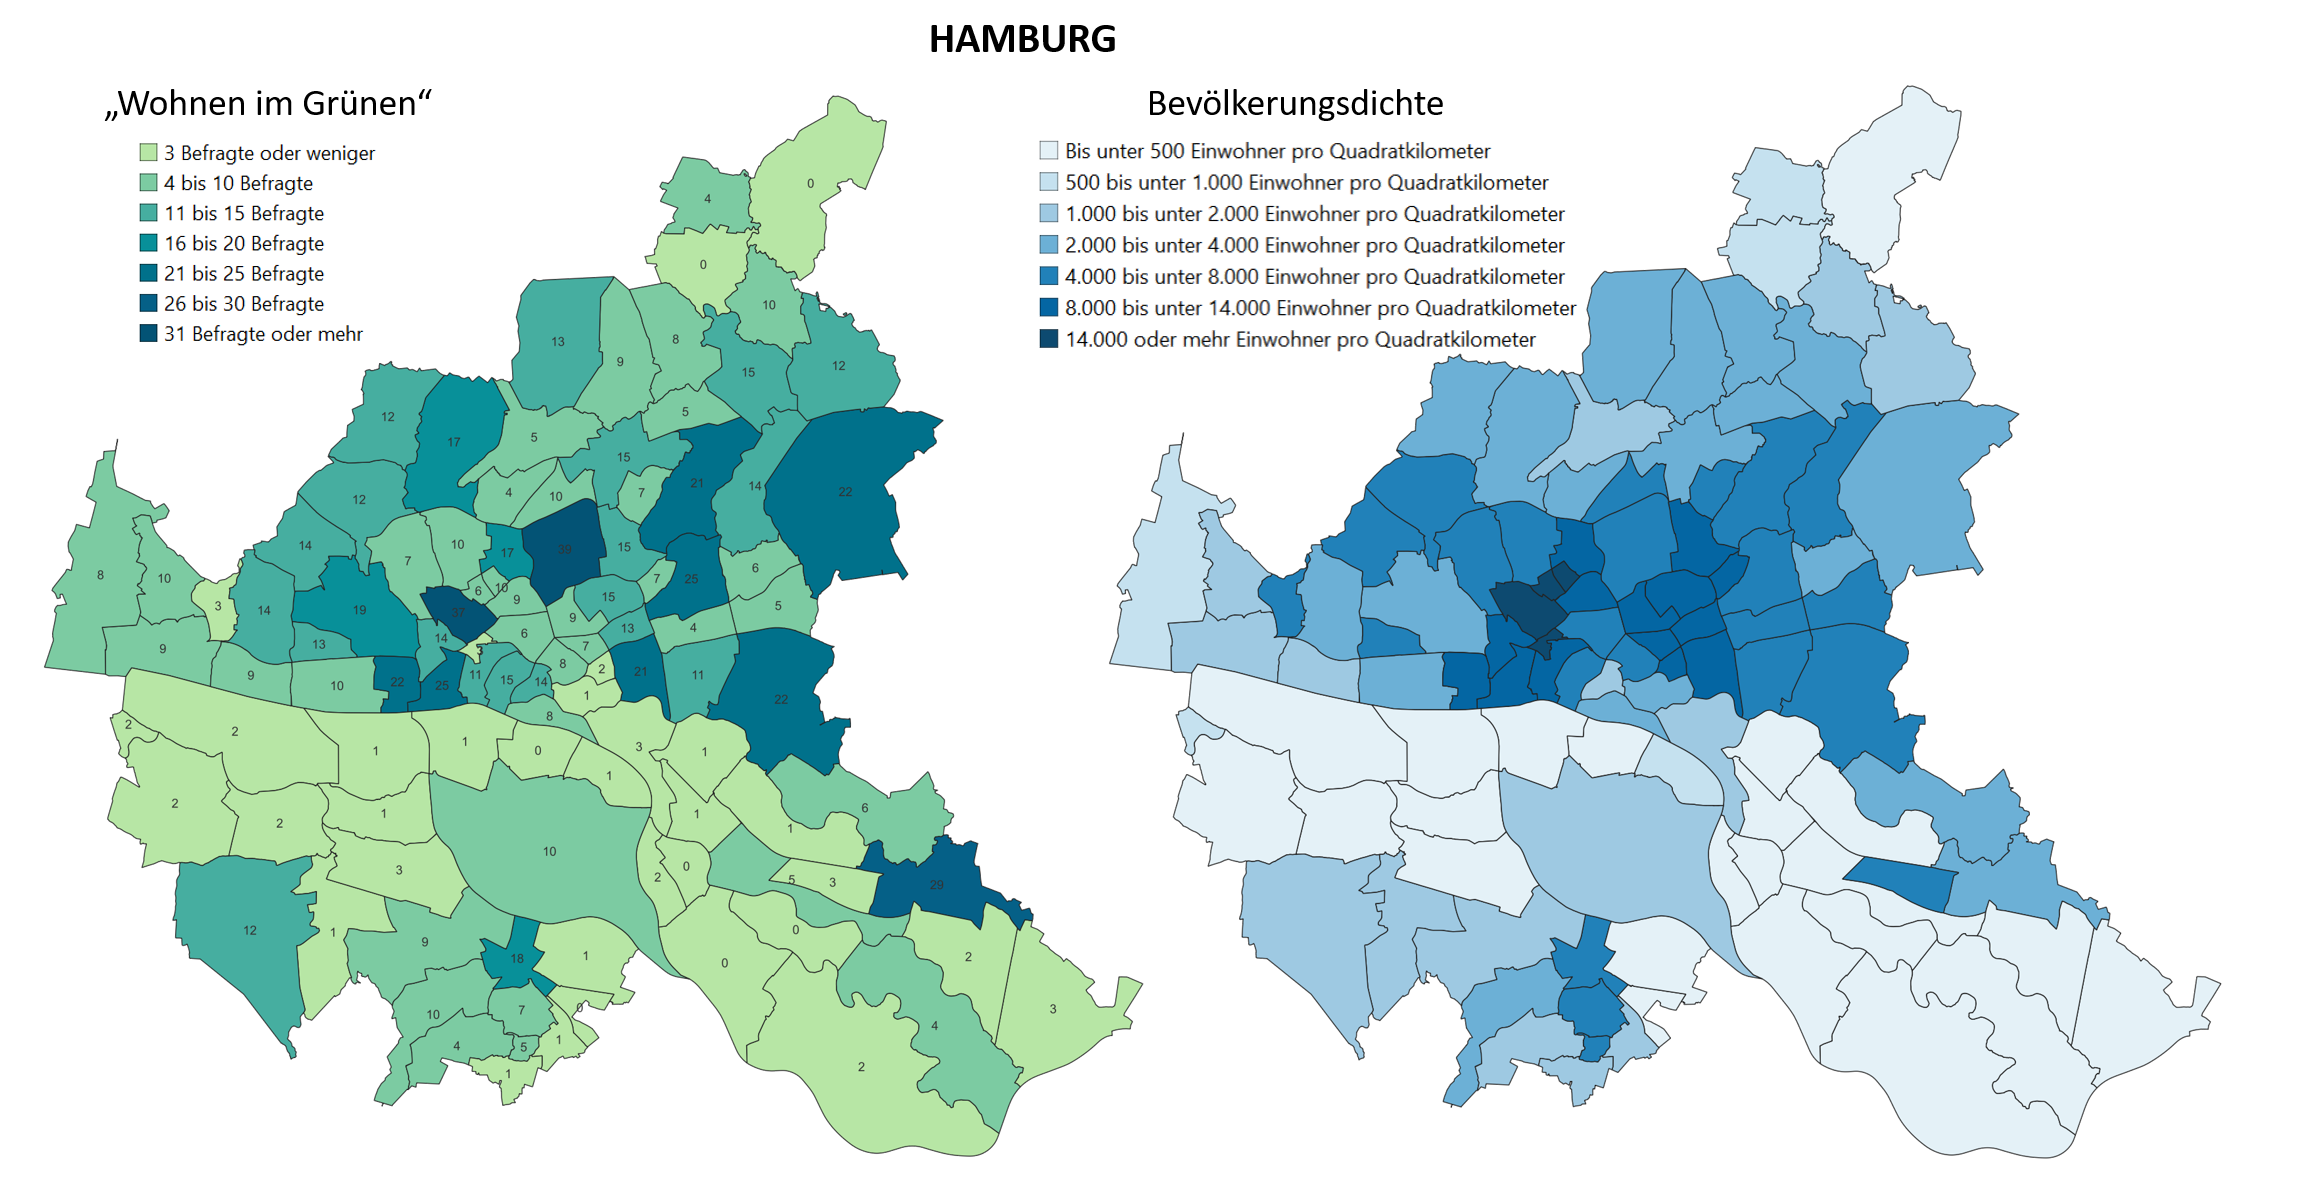
Note: Figure is in German.
Source: Statistical Office North (2021). Reference date: December 31, 2021. Own representation.
Also in Cologne, where respondents were mostly interviewed in centrally located neighborhoods, the number of respondents in individual districts accurately reflects the population density. The overrepresentation of residential addresses in Rodenkirchen, Lindenthal, and Mülheim again arises from the fact that these districts and the overarching districts share the same name, and subsequent differentiation between these entries is not possible.
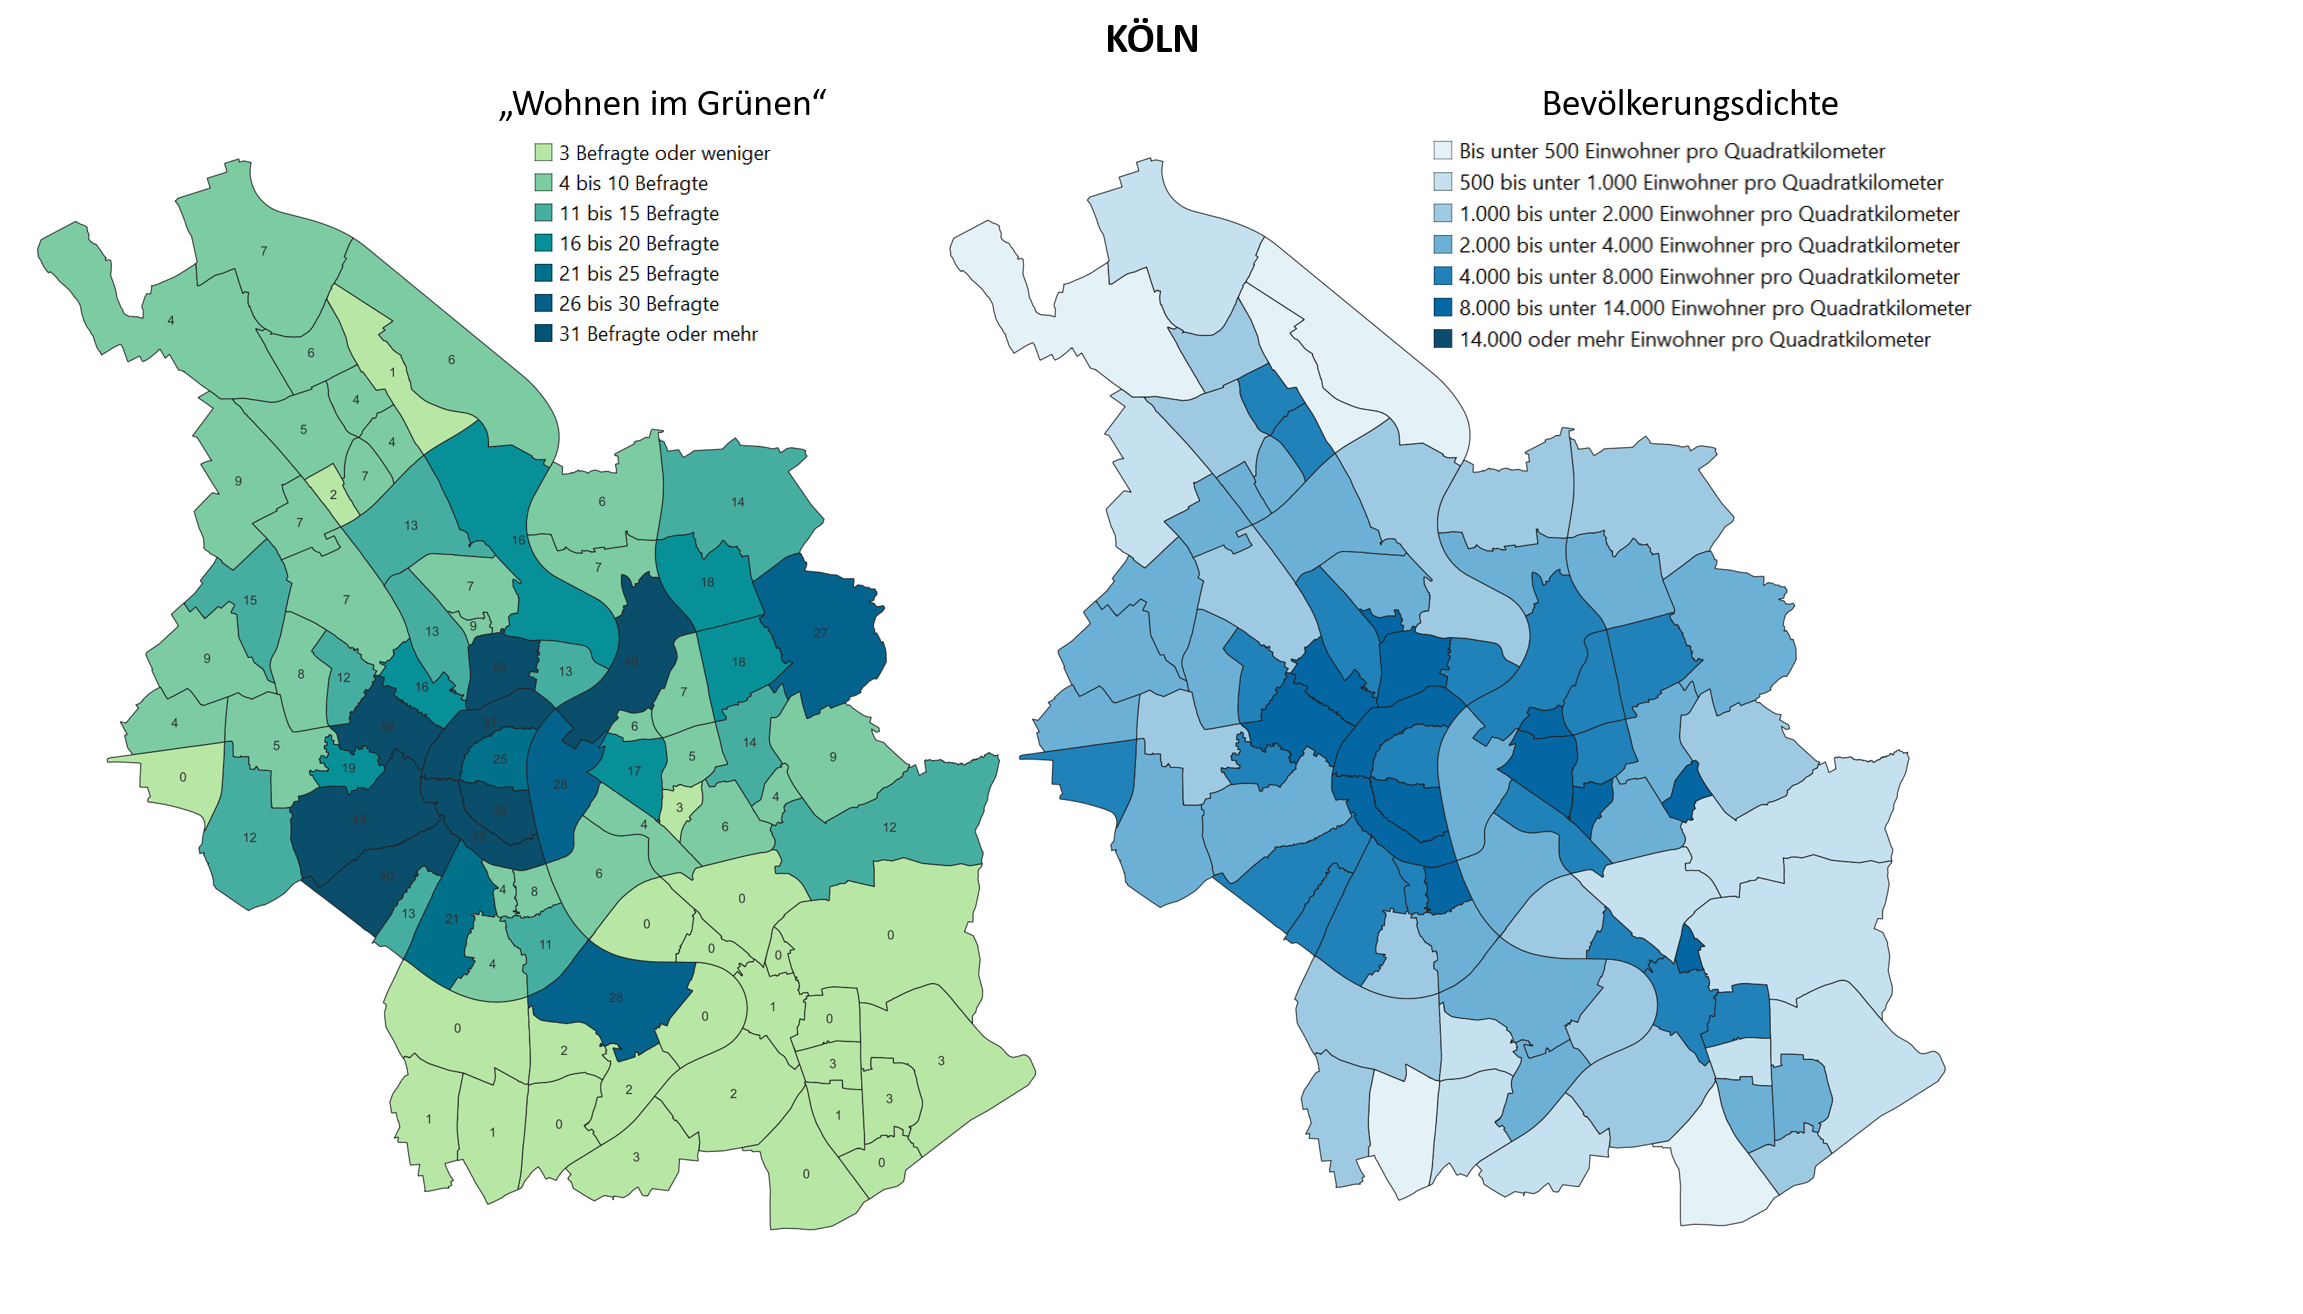
Note: Figure is in German.
Source: City of Cologne (2021). Reference date: December 31, 2021. Own representation.
In total, 904 individuals were reached in Hamburg, and 934 individuals were reached in Cologne, with 43 individuals in the outskirts of Hamburg and Cologne being interviewed due to the overlay of telephone area codes. These addresses were not taken into account in the graphical representation above.

